The Taverne du Testeur website is the most popular French-language blog dedicated to testing and quality. It recently underwent a facelift, providing a new interface.
Lately, topics related to the environment, sustainable quality and GreenIT have been very present because, as moderator and administrator, I’m very sensitive to the environmental and societal impacts of digital services.
Since 2022, there has been an acceleration in the number of publications (articles, conferences, videos, etc.) on the subject. These are the fruit of research, studies and discussions with specialists in the field such as Guillaume Kerrien, Lydie Huon, Sylviane Luong and Zoé Thivet.
All this work has given me a better understanding of the ins and outs of the changes needed to achieve sustainable quality. To better analyse the impacts but also the constraints that can lead to a lack of action to improve digital services on the subject.
In parallel with this work I obviously continued to produce the editorial work for the Taverne du Testeur blog… Until I realised several things:
- The blog of the Taverne du Testeur is a Digital Service. It therefore has an impact
- I was sharing my knowledge by talking about the importance of eco-design and reducing negative impacts… but didn’t apply it to the Taverne du Testeur
Following this realisation, my project to redesign the Taverne took on a whole new meaning: I didn’t just have to improve the site’s UX and accessibility, I also had to reduce its environmental impact!
So I embarked on a 3 steps project:
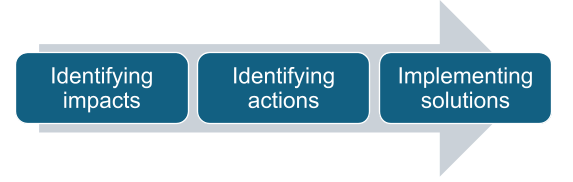
Identifying impacts
This is an essential step… and not a simple one.
There are very few ready-made tools for measuring environmental impact. Fortunately, I was aware of the RGESN (Référentiel d’Écoconception des Services Numériques) and the EcoIndex.
For me, these 2 elements were complementary, because the first is focused on eco-design, i.e. upstream work to limit impacts, and the second is more focused on operations and the direct impact of use. It’s a bit simplified, but it’s the idea.
The Taverne RGESN in April 2024:
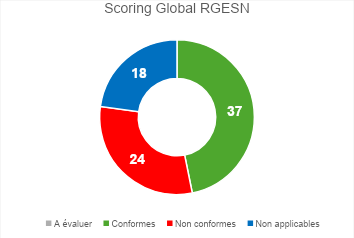
I then started work on the Taverne. I evaluated it in terms of the RGESN. The result: 46%!
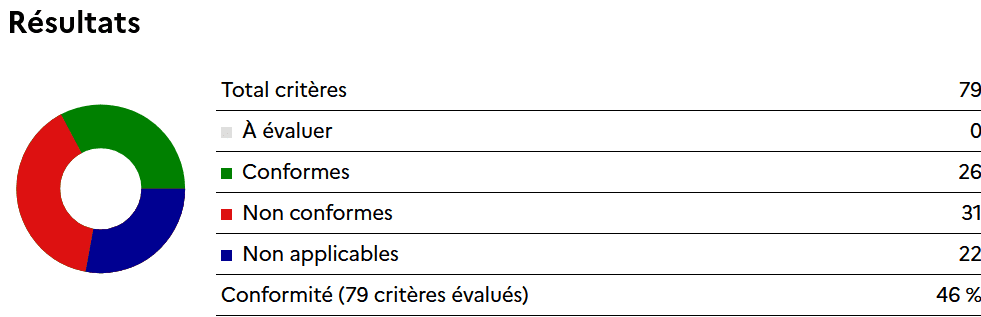
Unfortunately, I wasn’t very advanced. I had to push the analysis further… That’s what I did with the help of Julien Cahu!
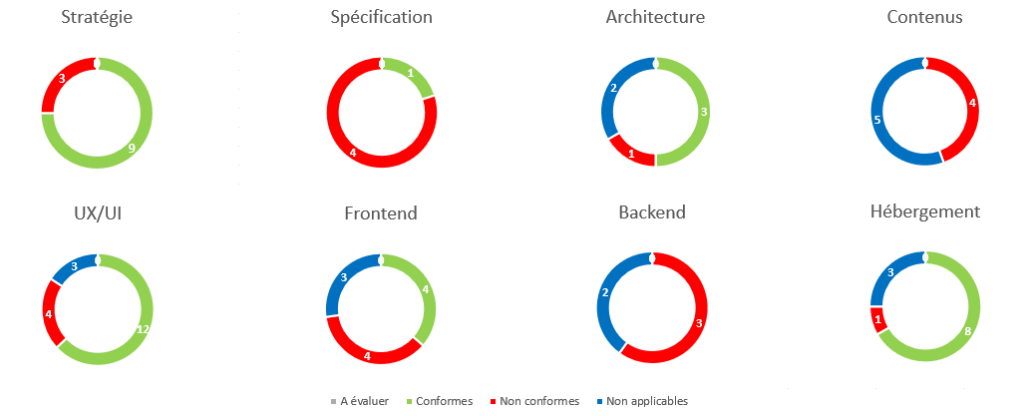
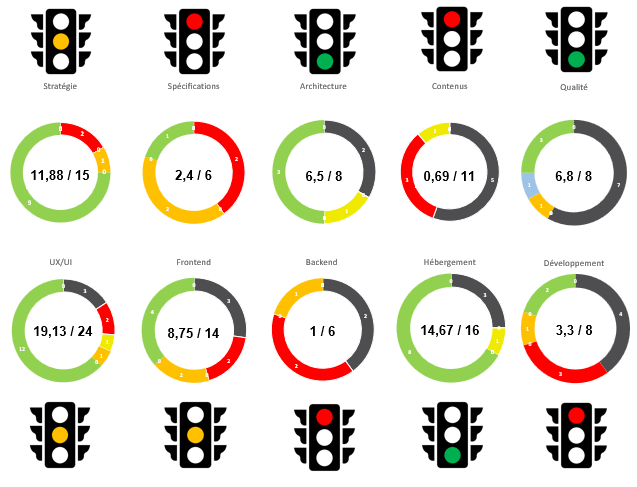
To make it easier to analyse the results and see how we could improve the Tavern’s impact, we analysed the results by theme of the RGESN. This gave us these indicators:
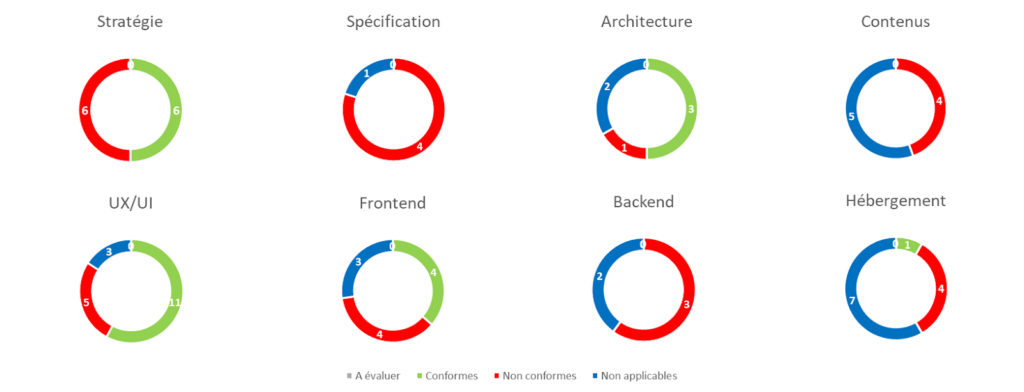
We then clearly identified 4 weak points: the specifications, the content, the hosting and the back-end.
It was now time to get to work on the EcoIndex.
The Taverne EcoIndex in April 2024:
The EcoIndex is a tool that analyses the environmental impact of viewing a page of a digital web service.
The idea is to measure the weight of the page, the number of requests required to display it and the complexity of the page. These 3 elements are used to calculate a score. Even if the method of calculation has its weaknesses (no cache, only the web, a particular page and not a route, no identification of the type of connection, etc.) it has the merit of providing a quick calculation and a point of comparison!
As part of my analysis of La Taverne, I carried out an EcoIndex analysis of several pages, including of course the 2 most frequently viewed: the home page and the page with the most-read articles.
The result, far from being catastrophic, brought out some interesting elements… which differed from page to page.
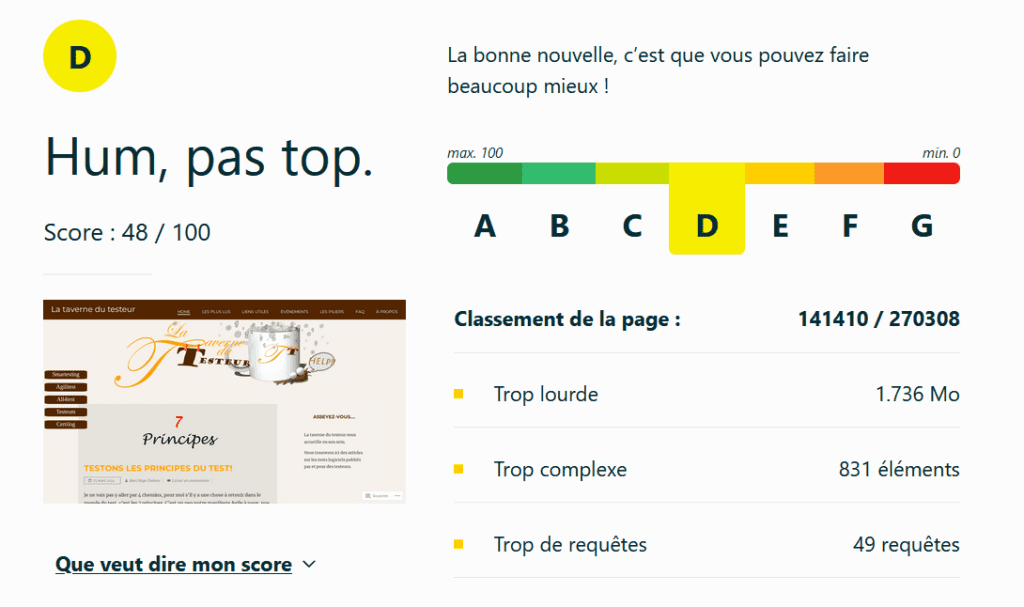
The home page and those of the most-read articles had the same D rating and an almost identical score of 48/100 for the home page and 49/100 for the most-read articles.
However, a more detailed analysis revealed major disparities: the home page was too heavy and too complex, while the most popular page had too many requests.
Homepage
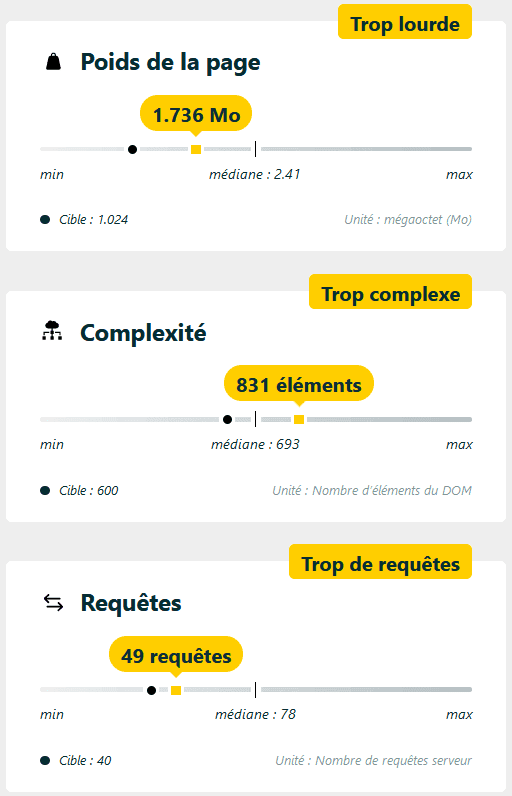
Most read
I might as well tell you that I wasn’t necessarily satisfied with these scores… Even though it was clear that the Taverne was one of the ‘good performers’ compared to the median of the pages evaluated, there was still a lot of room for improvement!
The Taverne’s score was 54/100, mainly thanks to the article pages, 75% of which were viewed, with a score of 56/100.
Identifying and implementing actions
Now that the measurements had been taken, I was able to move ahead with the actions.
Actions for RGESN:
For the RGESN, I decided to concentrate on the hosting part because even if the content, the specifications and the back-end were not very compliant, it was either complicated or not really useful for me to look into it:
- The Tavern provides very little content other than text and a few simple images: the real impact of the content was negligible.
- I saw little point in implementing criteria linked to specifications because the Tavern doesn’t have any.
- I had no real power to work on the back-end managed by WordPress.com.
On the other hand, I could easily work on the hosting by changing provider. The old one was based in the United States, whereas the majority of the audience was in France.
I then looked for a few ‘quick wins’ to improve the result quite simply, with, for example, the removal of 2 little-used pages that I was finding hard to maintain (the map and events).
Actions for EcoIndex:
Most of the work here was done by Hugo M, who redesigned the blog. For my part, I told him what I wanted: lighter pages, a minimum of elements in the DOM and to limit queries to the strict minimum on all pages.
Another thing I asked for was to stop having an ‘infinite page’ with all the articles without pagination.
Hugo has been careful to limit the number of requests, and has simplified/purified the design so as not to call on any additional libraries, in order to reduce the environmental impact as much as possible while maintaining and even improving the user experience.
Results
Following this work over just under 2 months, the Taverne’s RGESN rose to 61% (+15%):
With, as you can see, a big improvement in hosting and strategy:
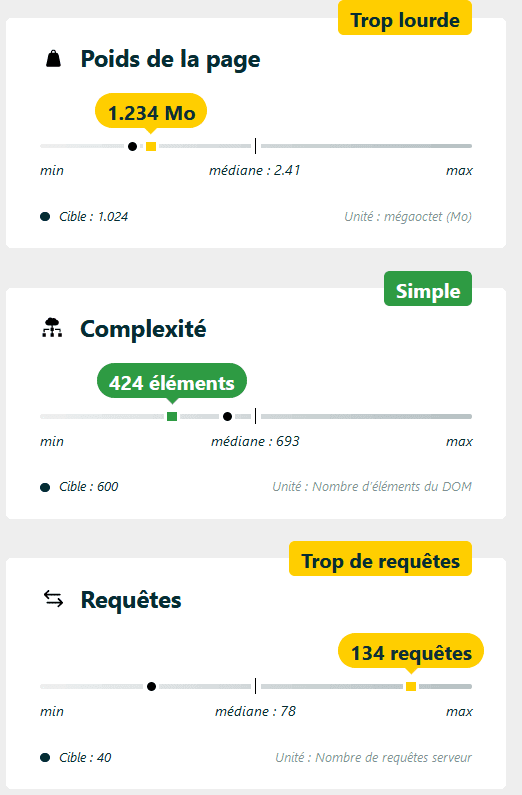
Similarly, the Taverne’s average EcoIndex has risen to 59/100, with a 67/100 for the home page, which has enabled this page to obtain a C grade (65/100 is required for a C).
Thanks to this work I managed to improve the Taverne’s environmental impact quite quickly and simply. I was still disappointed, however, because I had to use 2 tools, each of these methods has its flaws and, above all, it’s complicated to see the combined results of these methods.
So I had to go further.
Visualising environmental impact more easily.
In the course of our work, we identified theoretical and practical areas for improvement in the RGESN and the EcoIndex.
The points targeted with the theoretical axes :
– The introduction of the concepts of quality and development – RGESN
– The RGESN is difficult to link to quality and ISO
– Lack of indicators for the different axes
Work on these areas is progressing with our sustainable quality working group and Guillaume Kerrien in particular. In particular, we have established a link between the quality criteria of ISO-25010 and the criteria of the RGESN.
Difficulties targeted by the practical aspects:
– Evaluate the impact of each RGESN criterion (done in the RGESN 2024 version)
– All-or-nothing approach to validating the RGESN criteria
– The difficulty of linking the RGESN and quality in an operational manner
– Taking the cache into account – EcoIndex
– The impact of user scenarios – EcoIndex
– Analysis of non-web digital services – EcoIndex
– Taking account of connection type – EcoIndex
The work is ongoing, but we already have some results.
With Julien, as part of our work at K-LAGAN, we have developed an enriched RGESN which includes the Quality and Development themes and the stages for achieving each criterion.
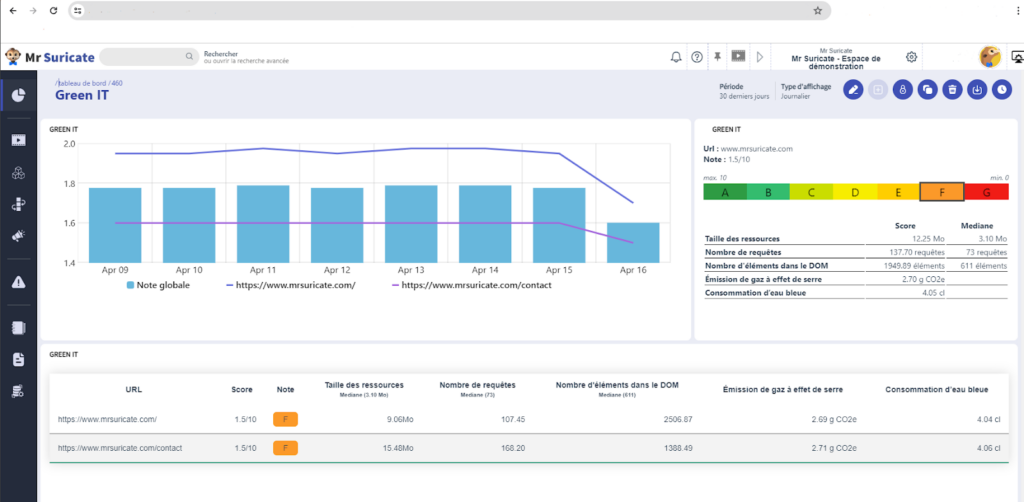
We have also teamed up with Mr Suricate to obtain EcoIndex scores for scenarios (and manage the cache) and provide more indicators:
We then devised the Envi’Score: an environmental score calculated on the basis of the results of the enriched RGESN and the EcoIndex score of the representative scenarios.
The Envi’Score awards a grade from A to F:

And it is communicated quite simply by means of a badge:

As for the Taverne, it has gone from a C limit D to a C limit B. I still have some way to go to reach a B grade, but it’s not impossible!